Introduction
Effective resource monitoring is key to optimizing your Hyper-V environment, and PowerShell makes this easier than ever with its resource metering features. In this guide, we’ll explore how to enable and utilize metering features to optimize your virtual infrastructure.
What is Hyper-V Resource Metering?
Hyper-V Resource Metering is a powerful feature that allows administrators to monitor the resource consumption of virtual machines (VMs) within a Hyper-V environment. By tracking key metrics such as CPU usage, memory consumption, network traffic, and disk utilization, resource metering provides a detailed view of how each VM is performing over time.
Whether you’re managing a small lab or a large-scale production environment, understanding and utilizing resource metering is essential for maintaining control over your virtual resources.
Enabling Resource Metering
Before you can start collecting and analyzing resource usage data, you need to enable resource metering on your virtual machines. This can be done easily using a single PowerShell command:
Get-VM * | Enable-VMResourceMetering
This command enables resource metering for all virtual machines on your Hyper-V host. Once enabled, Hyper-V begins tracking various metrics, allowing you to monitor the performance and resource consumption of your VMs.
After enabling resource metering, it’s essential to confirm that the feature is active on your virtual machines:
Get-VM | Format-Table Name, State, ResourceMeteringEnabled
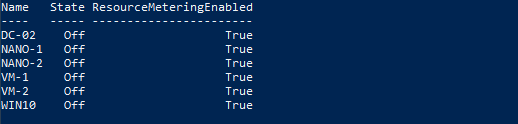
This command outputs a table listing each VM by name, its current state, and whether resource metering is enabled. If “ResourceMeteringEnabled” show “True” for the VMs, it means resource metering is successfully activated and ready to start collecting data.
Adjusting the Collection Frequency
By default, Hyper-V’s resource metering collects metrics every hour, providing a steady flow of data for long-term analysis. However, in some scenarios, you might need more frequent updates, such as when you’re closely monitoring performance during a workload test.
In this example, we will adjust the Collection Frequency to 1 minute:
Set-VMHost -ResourceMeteringSaveInterval 00:01:00
This command changes the interval to one minute, allowing for more granular data collection.
Retrieving VM Statistics
Once resource metering is enabled and configured, you can begin collecting performance data from your virtual machines. To retrieve basic statistics for all VMs, use the following PowerShell command:
Get-VM | Measure-VM
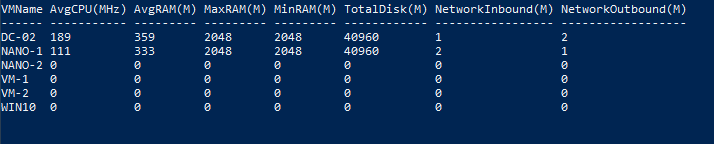
From the example output, we can see that an overview of key metrics, such as CPU, memory, and storage usage. The amount of CPU and RAM allocated to each VM should match the needs of its workload. If “AvgCPU” or “AvgRAM” is consistently high, it might indicate that the VM needs more resources or that the workload should be distributed across additional VMs.
For critical applications, you might aim to keep AvgCPU and AvgRAM usage within lower thresholds (e.g., below 70%) to ensure there is headroom for spikes in demand.
For less critical applications, higher usage might be acceptable as long as the performance remains within acceptable limits.
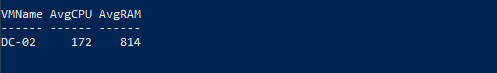
For more specific data, you can target individual VMs. For example, to gather the average CPU and RAM usage for a VM named “DC-02”, run:
Get-VM -Name DC-02 | Measure-VM | Select-Object VMName, AVGCpu, AVGRam
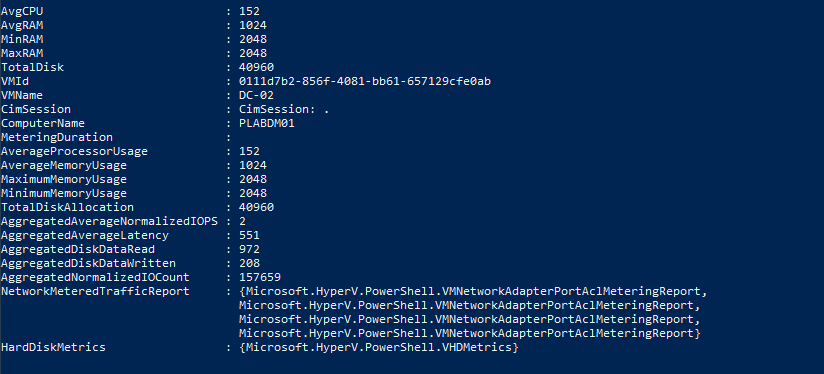
If you need a comprehensive set of metrics for in-depth analysis, you can collect an extensive list of statistics from a VM, such as “DC-02”:
Get-VM -Name DC-02 | Measure-VM | Select-Object *
Resetting Resource Metering
Over time, as resource metering collects data, you may need to reset the metrics to start fresh, particularly when analyzing new workloads or after making significant changes to your environment. You can reset the resource metering on all virtual machines with the following command:
Get-VM * | Reset-VMResourceMetering
Regularly resetting metering data can also help in maintaining accurate and relevant metrics, ensuring that your analysis reflects the most current state of your virtual environment.
Disabling Resource Metering
When you’re finished collecting and analyzing resource usage data, you may want to disable resource metering to conserve system resources and reduce overhead. Here is the command:
Get-VM | Disable-VMResourceMetering
This command turns off resource metering for all virtual machines on your Hyper-V host. Once disabled, Hyper-V will stop collecting resource usage data.
To ensure that resource metering has been successfully disabled, you can verify the status using this command:
Get-VM | Format-Table Name, State, ResourceMeteringEnabled

By disabling resource metering when it’s not required, you help maintain optimal performance in your Hyper-V environment, ensuring that system resources are allocated efficiently without unnecessary monitoring overhead
Conclusion
In short, this guide shows you how to enable, customize, and utilize Hyper-V Resource Metering with PowerShell to monitor and optimize your virtual machines effectively.